Monitoring your home internet connection because boredom
Early in the COVID-19 lockdown extravaganza 🎉 my wife and I purchased a new home and moved in. It was a stressful time, filled with uncertainty. In the aftermath, I found myself with pretty terrible internet service and since we are both working in isolation, I am hellbent on finding out why …
So I'll use the tools I know – Telegraf, InfluxDB, Grafana, and Docker – to collect data, analyze it, and still probably not figure it out … but it's something to do.
This post is not aimed to be a step-by-step guide, as much as it is a mental dump. I aim to give you ideas and resources so if you want to replicate this kind of thing yourself you can do your own research to figure it out on your own.
Overview
My main goals were to meaure the quality of my internet connectivity and provide a dashboard or two so I can see short term and long term changes and trends. I set out to do this in two main ways: perform regular tests and pull spectrum analysis data directly from my cable modem.
Performing tests is really common and what you'd expect: send pings and perform http requests. Pulling data out of a cable modem is something I've never seen before and I wasn't sure if it was even possible (it is).
I ended up using a raspberry pi for data collection since it's always online (it's also my pi-hole) and using my Windows PC for storage and reporting. I may move things to a 2nd Raspberry Pi, but since I wanted to store a ton of data, I opted to keep the database local until I can build a better storage system.
Raspberry PI:
- Telegraf
- A Ruby Script to pull data from my modem
Windows 10 PC:
Here's what it ended up looking like:
Docker
I'm not going to cover setting up Docker. It's been done and you can find some really great articles about how to go about it. I'll only tell you about my environment.
I'm hosting this on my Windows 10 PC (I am a gamer, after all) with Docker Desktop. However, I do most of my command line work inside of Ubuntu running on the Windows Subsystem for Linux (bonus shoutout to the Windows Terminal Preview for finally making this not awful).
InfluxDB
InfluxDB is my main squeeze for timeseries data. We use it a ton at Rigor for both customer facing data, as well as all of our internal operational metrics storage and reporting.
I'm running this inside of docker, with the following command:
docker run --name influxdb \
  -e "INFLUXDB_ADMIN_PASSWORD=V$5gQ7*dX^z^5EvT8v7N01IXbom*XJBx^f" \
  -e INFLUXDB_ADMIN_USER=admin \
  --restart=always \
  -p 8086:8086 \
  -v "E:\Docker\influxdb-data:/var/lib/influxdb"
  influxdb
This does the following:
- Sets environment variables which will instruct the service to create a first user (no, that's not my real password)
- Instructs Docker to start the container on boot and always restart it if it fails
- Exposes the InfluxDB API port publicly (port 8086)
- Mounts a folder as a volume so we persist the delicious data no matter what
Important note: since I'm mounting a volume, I must run this in a Windows shell and not inside Ubuntu
You'll likely want to also start a Chronograf container temporarily, so you can manage your InfluxDB server and set it up however you'd like. Perhaps you want a database just for this data? Perhaps you want to create a write-only use for Telegraf? Chronograf will make it easier.
Telegraf
The 'T' in the TICK stack – Telegraf is a massively powerful data collection application. It's easy to overlook how wonderfully useful this application is because of how simplistic it appears. I'll configure it to perform all my tests and run my own script to pull data from the cable modem, batch it up, and ship it to influx on a fast schedule.
Keep in mind that Telegraf only keeps data in memory. This has two important implications when it cannot send data to its outputs:
- it will continue to consume memory to hold data until it OOMs
- it will loose all data it hasn't shipped if it crashes These, to me, are Telegraf's only real drawbacks. They aren't deal breakers for most applications, but they're important to note since it's possible you can drop data in some scenarios.
Again, I'm not going to detail how to install Telegraf – let Google be your guide there, but once you have it installed it should be as simple as editing the /etc/telegraf/telegraf.conf file and restarting the telegraf service (sudo service telegraf restart on Ubuntu).
Here's an sample of my telegraf config file. Notice that it has a single output – Influxdb – and a number of inputs – ping, http_response, and my own ruby script.
Ruby Script
Many cable modems have a web interface just like home routers – most people don't know about it, but there it is. Most of the time, you can reach it at http://192.168.100.1 and the login is either on a sticker on your cable modem, or it's something incredibly common. For my Netgear CM1200, it's admin/password.
Once you login, you should be able to get some pretty detailed measurements about your connection. This is an actual spectrum analysis that the cable modem performs and shows you a single snapshot.
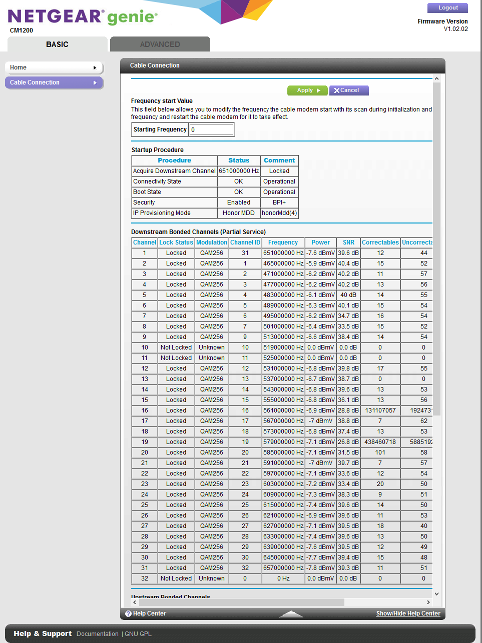
I looked into using "real" monitoring protocols, like SNMP, to pull this data but my cable modem doesn't support it and it's unlikely yours will, either. Most consumer level network devices don't expose these kinds of protocols – any why would they, anyway?
So, I had to take a dirtier approach: web scraping. You hate it. I hate it. Let's get it over with.
➡ Look at my fabulous Ruby script here!
This script will connect to the web interface, grab the HTML for the page pictured above, and pull data out using regular expressions. (Un-)Luckily, the web interface doesn't generate html tables server side. Instead, it writes out all the data to a Javascript variable in a pipe-delimited format. This makes for easier regular expression patterns and since the HTML output is very stable (at least until a firmware update changes the interface), I can just grab the exact line number holding the variable I want. Ugly, for sure, but #ShipIt 🚀.
Grafana
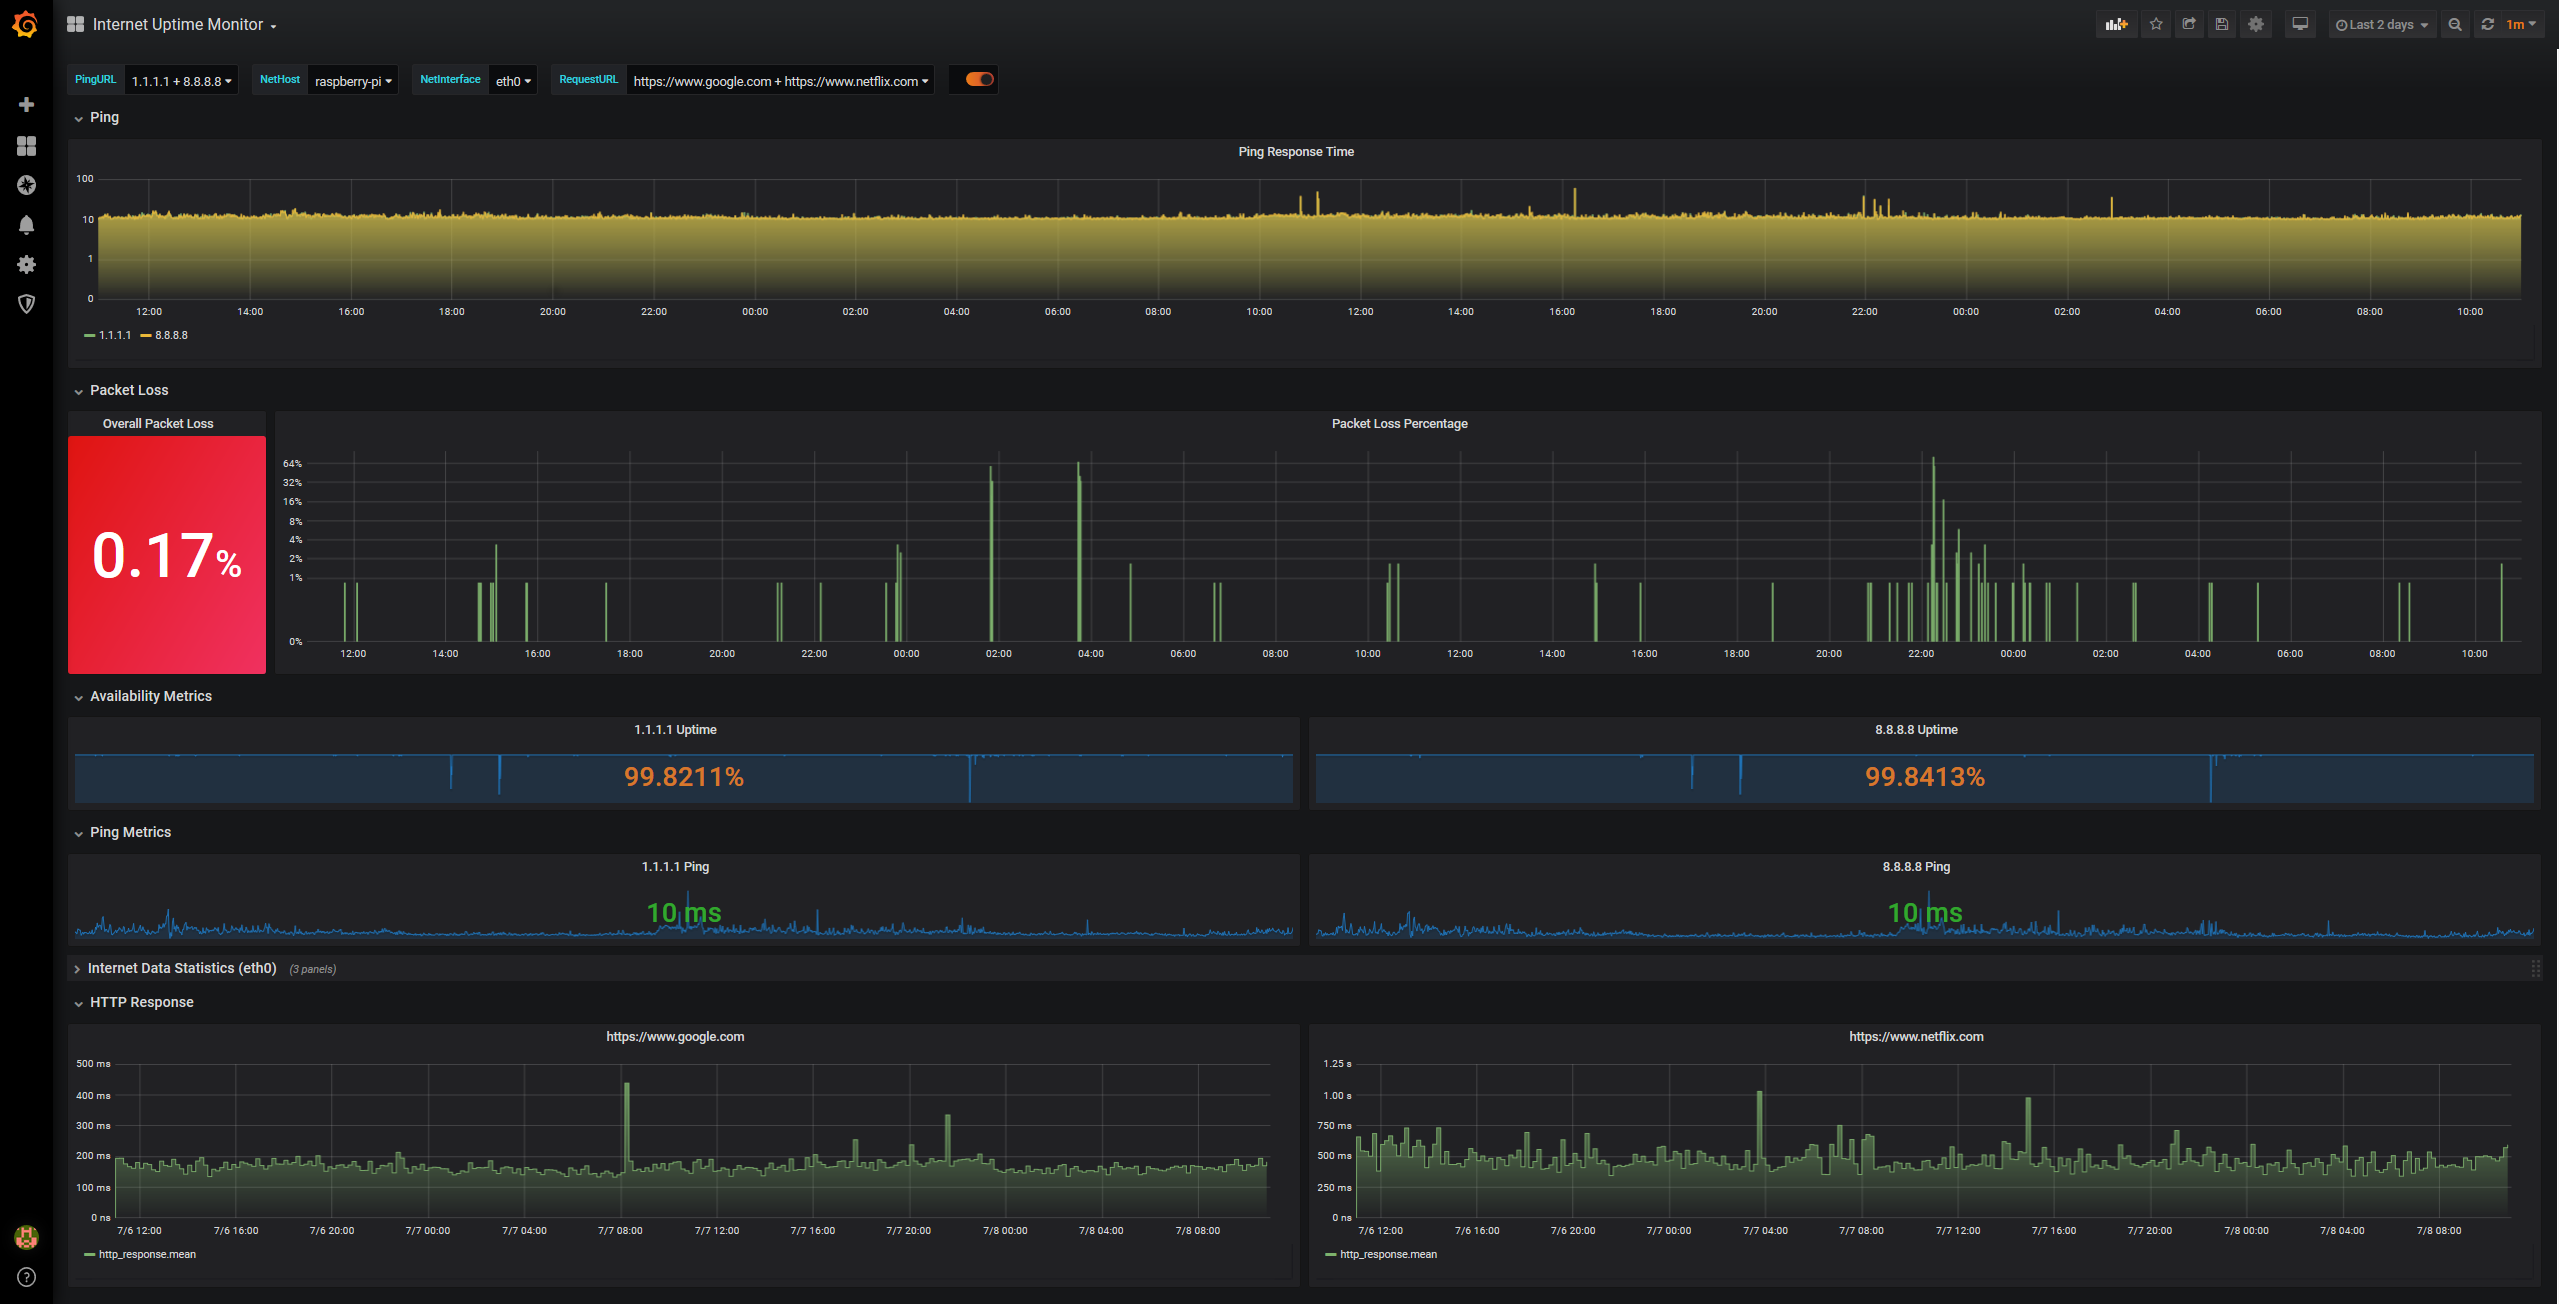
Finally, the last step – creating a dashboard to dazzle your friends and blog readers.
Yet, again. I won't spend any real time getting Grafana running. I just use Docker:
docker run --name grafana -p 3000:3000 grafana
Once grafana is running, I configured an InfluxDB datasource, and created my dashboards.
Here's the JSON export of my dashboards – you'll need to tweak it if you're trying to recreate this, for sure.
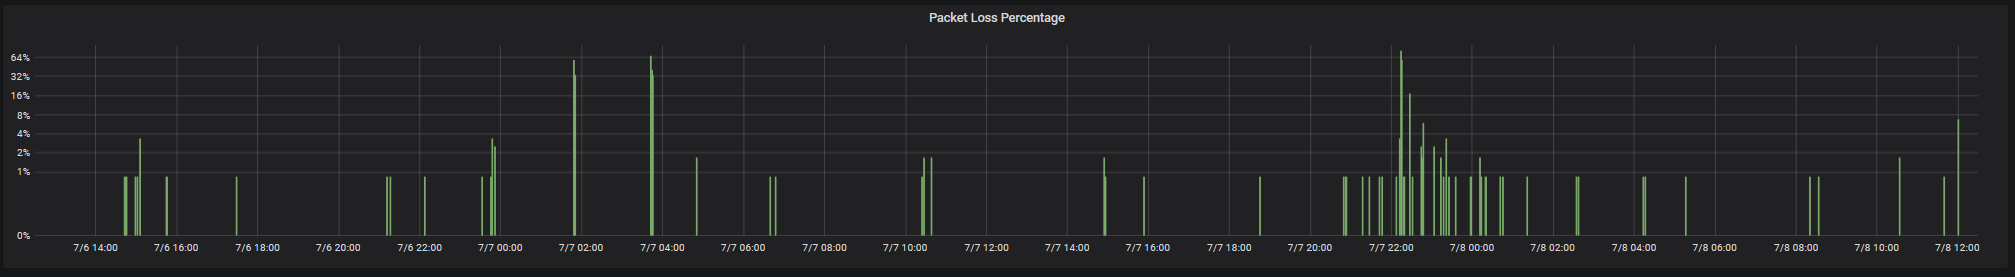
What did I learn?
Once this whole thing was up and running, I immediately found that I was having pretty serious packet loss.
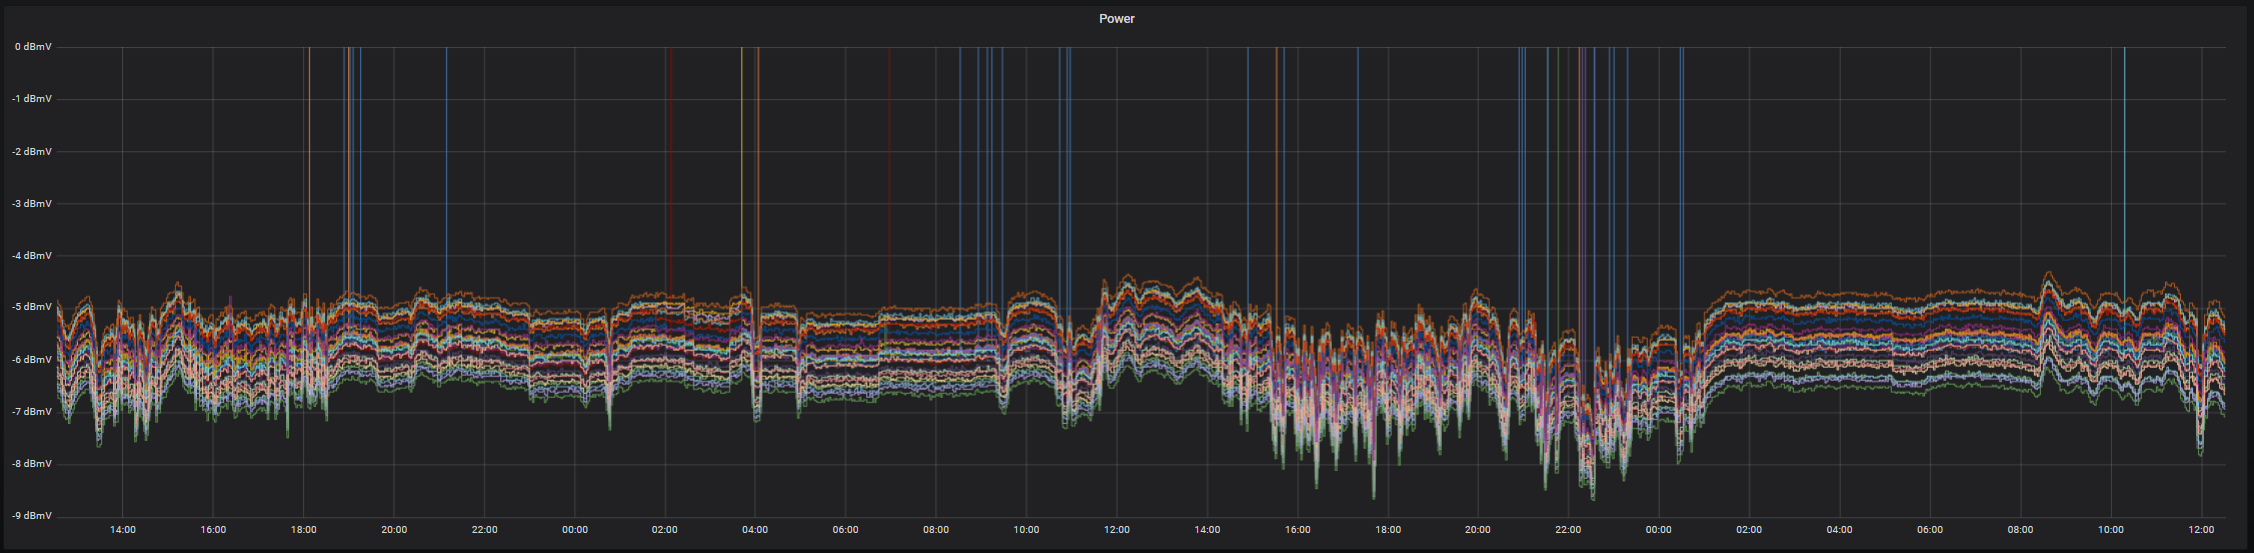
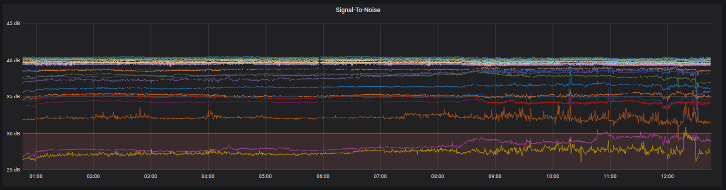
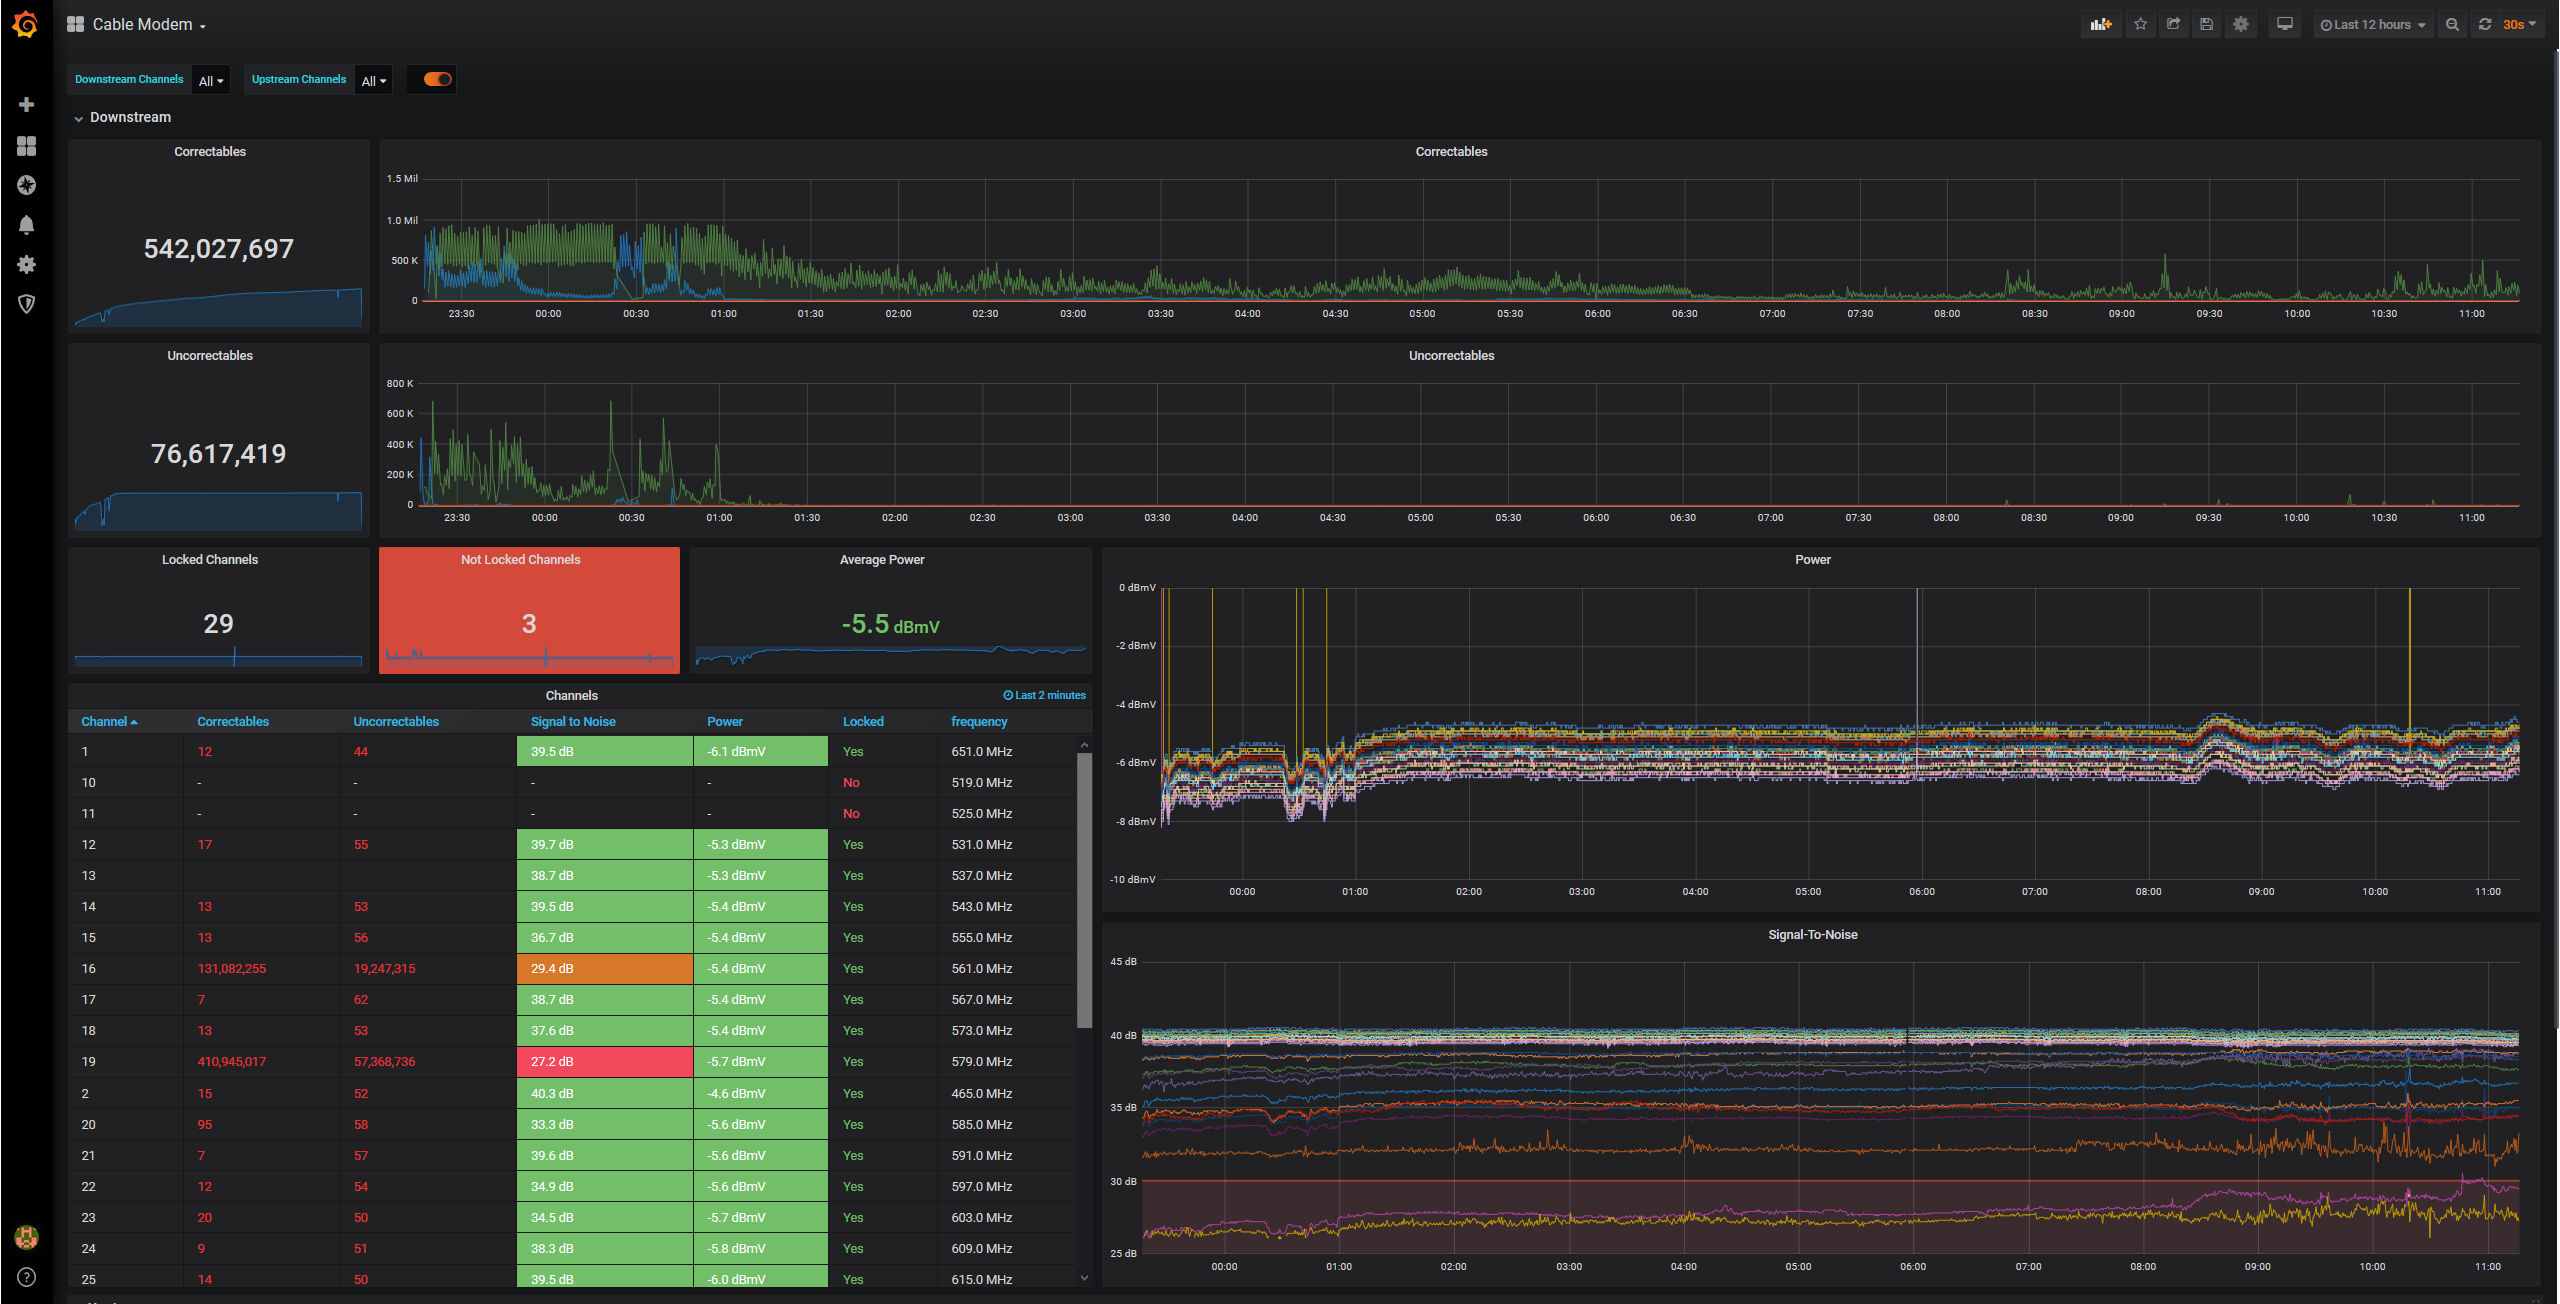
I also found that there are a number of frequencies on which my cable modem is unable to obtain solid locks and others that vary greatly through the day.